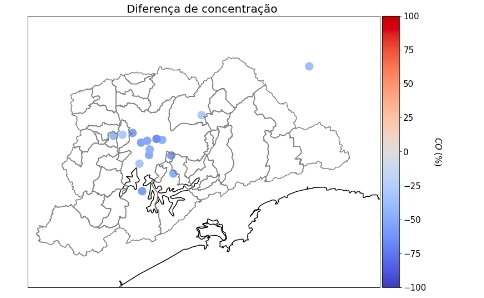
A drastic reduction in traffic due to the coronavirus lockdown resulted in a rapid decrease in airborne pollution: The levels of carbon monoxide fell by 50% in São Paulo City in a single week (image: Mario Gavidia Calderon)
Published on 03/23/2021
By Maria Fernanda Ziegler | Agência FAPESP – The lockdown due to COVID-19 began in São Paulo City on March 24. One week later, the level of airborne pollution had fallen by approximately 50%, according to atmospheric data published by CETESB, the São Paulo state environmental agency, for March 15-21 and 22-28.
“There’s less noise. You can hear the birds. There is also less air pollution. The clearer sky that has been visible since lockdown is due to the reduction in vehicular traffic, which is the main source of air pollution in São Paulo. Many vehicles have stopped operating, leading to a drop in primary pollutants such as carbon monoxide [CO, emitted mainly by cars] and nitrogen oxides [NOx, emitted mainly by diesel vehicles], which can be confirmed by the atmospheric data,” said Maria de Fátima Andrade, a professor at the Institute of Astronomy, Geophysics and Atmospheric Sciences (IAG-USP) at the University of São Paulo. Andrade analyzed the CETESB data at the request of Agência FAPESP.
In addition to the significant decrease in the levels of primary pollutants directly linked to vehicle emissions, there was also a decrease of approximately 30% in respirable particulate matter, which are fine particles classified as either PM10, since they have a diameter of 10 micrometers or less, or PM2.5, which have a diameter of up to 2.5 micrometers. PM10 is mostly resuspended dust, while PM2.5 mainly comes from vehicle exhaust and other kinds of combustion.
Inequality in pollution
According to Andrade, pollution has not decreased equally throughout the city. “The maps show a greater fall in the city center. Air quality has improved unequally, depending on the region. It’s also clear that in the region of Cubatão [a city located some 60 km south of São Paulo], for example, the levels of some pollutants have risen, since their sources are industrial,” she said.
Particulate matter is a health hazard when people are exposed to more than 25 micrograms per cubic meter of air (µg/m³) on average in a 24-hour period, according to the World Health Organization (WHO). Several CETESB monitoring stations typically show higher levels.
Levels of pollution in the city are also unequal under normal circumstances, based on another study by Andrade and the research group she leads. Some monitoring stations (e.g., Osasco, Grajaú and Mauá) regularly detect particulate matter levels close to 40 µg/m³, while others observe particulate matter levels just over 25 µg/m³ (Capão Redondo, Diadema and Cerqueira Cesar). The difference is mainly due to the age of the vehicle fleet and the traffic density in the areas of concern.
Any comparison between normal circumstances and those under lockdown should of course consider a period longer than two weeks, Andrade added. “Ideally, we would compare longer periods in different years, but when you analyze the data for March 2019, you find that there were relatively low levels because it was a very wet month. Rain is the main mechanism for removing airborne pollution,” she said.
Analyses of pollution and comparisons between different periods must take the weather into account. “It’s important to stress that the comparisons will be better when we have more data and can take all the other conditions into account, especially the weather,” she said.
The weather when lockdown started on March 24 was very similar to the weather of the week before. “I would have expected to see increased levels of pollution in that kind of warm, dry weather, but in fact, they fell considerably, especially levels of pollutants associated with fuel combustion,” she said.
The maps that accompany this article were produced by Mario Gavidia Calderón, a PhD student at IAG-USP.
New measurements
The unusual pattern of airborne pollution in São Paulo City during lockdown will be the focus of a detailed study by the research group at IAG-USP. “Even though the pandemic is distressing, the situation offers what could be called a unique forced experiment in terms of atmospheric pollution. The measurements we can make under these circumstances would be practically impossible in normal times,” Andrade said.
The data collected during lockdown will be subjected to more robust analysis, and new measurements will be obtained. “The significant decrease in the main source of pollution [traffic] affords an opportunity for improved monitoring of other sources, such as wood and charcoal burning for cooking, which is often called indoor pollution,” Andrade said.
These low-level sources account for less than 10% of the total atmospheric pollution in the city and are typically estimated rather than measured. “The pollution caused by traffic, which is predominant, gets mixed up with the pollution caused by other sources in the usual measurements. Our new studies will be able to quantify these other sources properly,” she said.
Andrade is also conducting a project supported by FAPESP to study the behavior of greenhouse gases. “As part of this FAPESP-funded Thematic Project, we plan to inventory greenhouse gas emissions in São Paulo City,” she said.
Greenhouse gas emissions are typically estimated or extrapolated from other data. “We expect that the measurements we’ll obtain during this period will provide information that will increase the knowledge of these emissions,” Andrade explained. “We’ll be able to obtain data from measurements instead of estimates. The main source of CO2 emissions in São Paulo is the combustion of fossil fuels, so they are correlated closely with traffic levels. Vegetation is also known to play a key role in the absorption of CO2. We expect the decrease in pollution by vehicle traffic in this period to make it easier to separate the contribution of this pollution source from the contributions of vegetation and temperature to the overall level of CO2.”
Source: https://agencia.fapesp.br/33086
